This application assesses dose effects on adult worm activity.
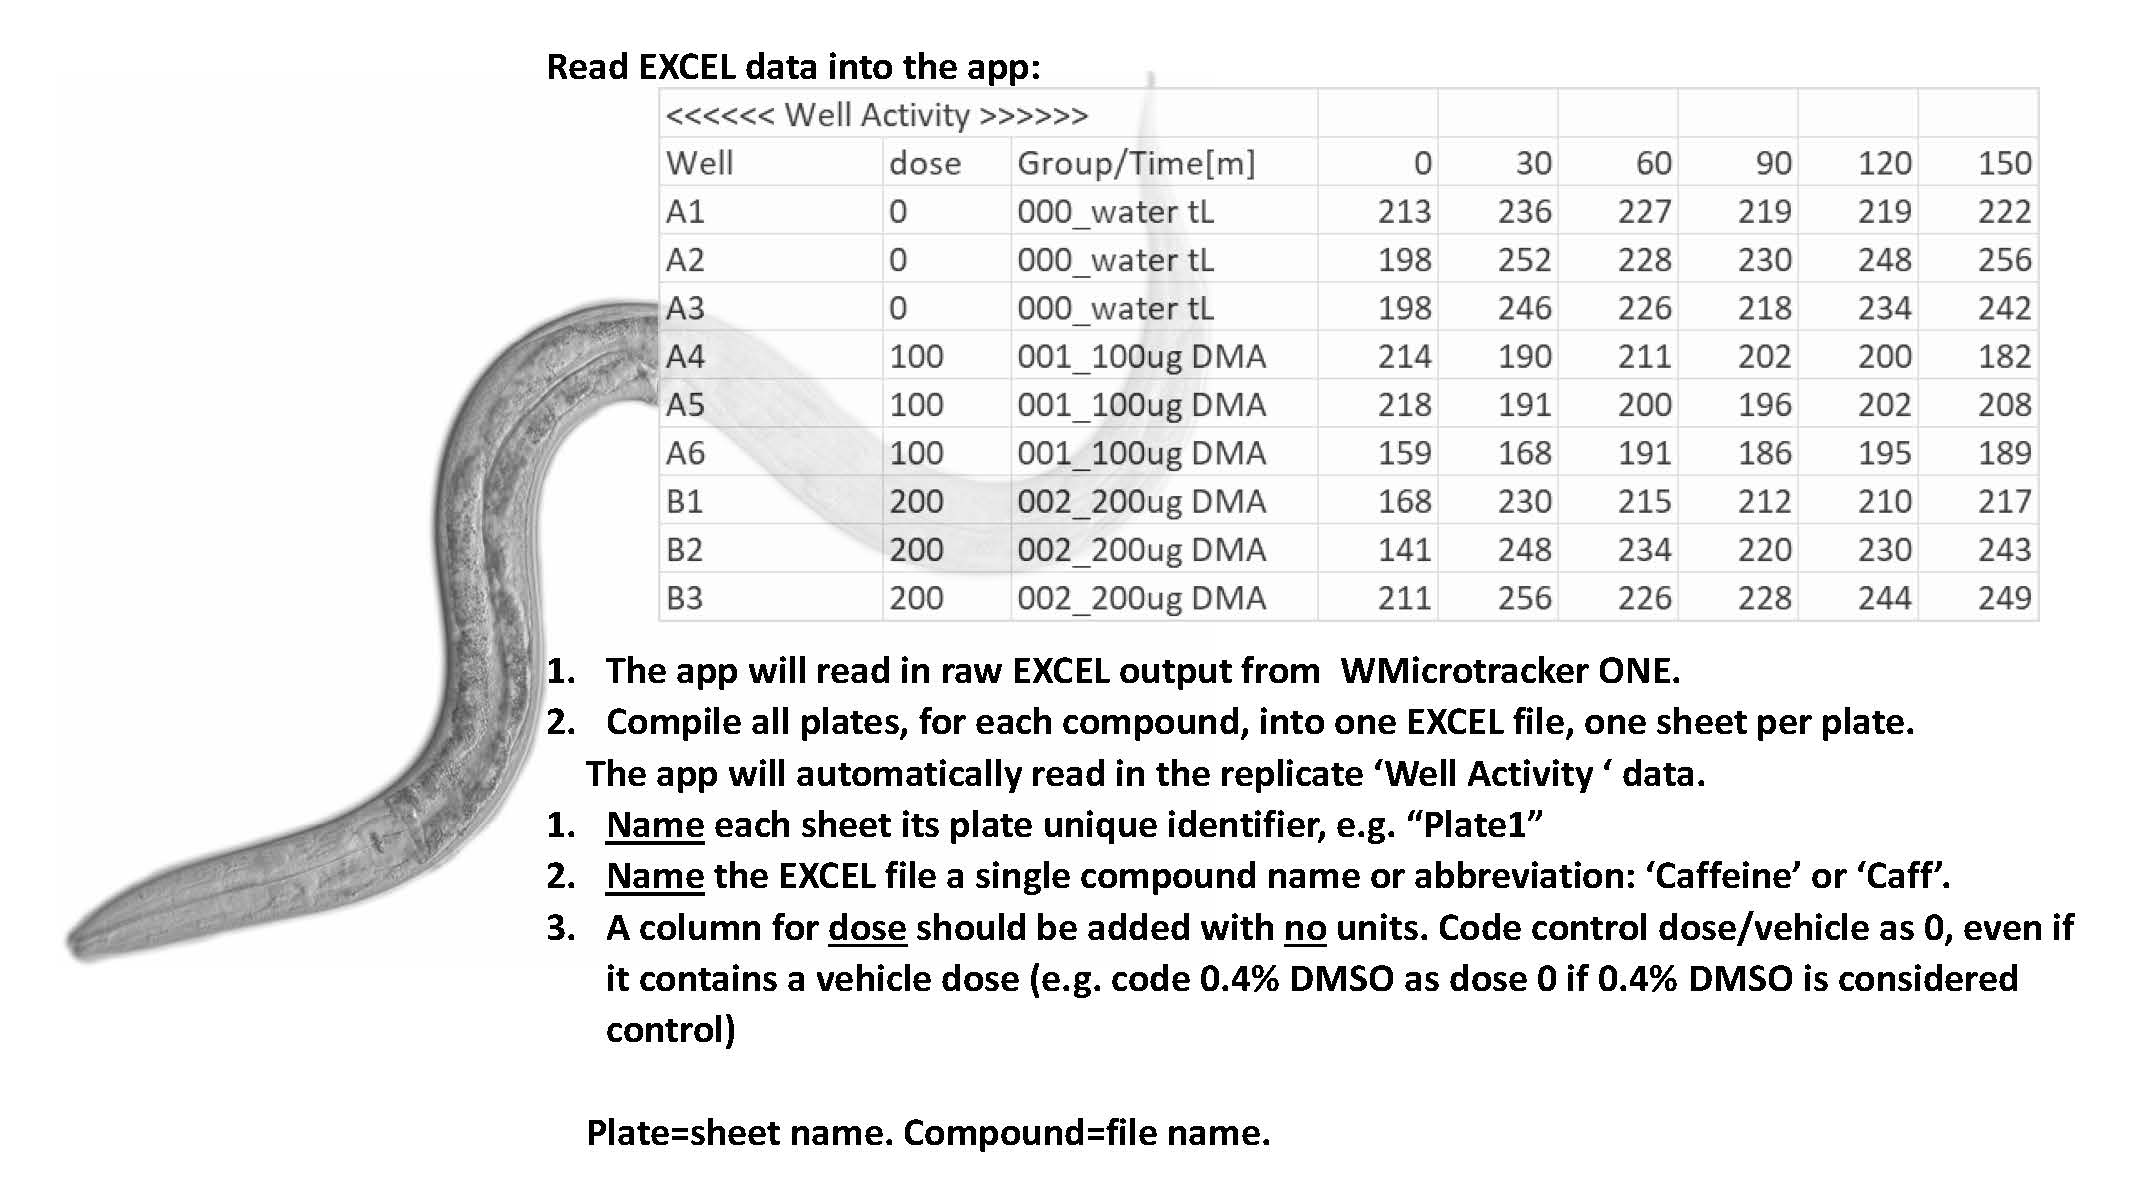
1. Upload EXCEL file of data. See image above for data format
2. Quality Control : plot the control (vehicle) samples and apply acceptance criteria to plate
3. Plot : the mean standardized dosed data
4. Fit the model and estimate dose effect endpoints. Rank doses
5. Assess the quality of prediction by plotting the predicted vs. actual values.
By default all plates are included in the
analyses.To exclude a plate, please unselect it.
Cells colored yellow failed
the acceptance criterion
Higher tP indicates longer time until Peak.
Higher tH indicates longer hyperactivity period.
Higher Peak indicates stronger induced hyperactivity.
ETp is expected time at which the pth percent of baseline is achieved, where baseline is Y at time 0 (i.e. Y=1). For example ET50, is the expected time for 50% of baseline, i.e. Y=0.5.